
Page 353 - asuransi bintang annual report flipbook 2023
P. 353
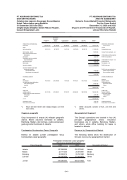
PT ASURANSI BINTANG Tbk DAN ENTITAS ANAK Catatan atas Laporan Keuangan Konsolidasian Untuk Tahun-tahun yang Berakhir 31 Desember 2023 dan 2022 (Angka-angka Disajikan dalam Ribuan Rupiah, kecuali Dinyatakan Lain) PT ASURANSI BINTANG Tbk AND ITS SUBSIDIARY Notes to Consolidated Financial Statements For the Years Ended December 31, 2023 and 2022 (Figures are Presented in Thousands of Rupiah, unless Otherwise Stated) 2022 PENDAPATAN OPERASIONAL Premi bruto HASIL Hasil underwriting Hasil investasi - bersih Beban usaha yang tidak dapat dialokasikan Laba usaha Penghasilan lain-lain yang tidak dapat dialokasikan Laba sebelum pajak Beban pajak Laba tahun berjalan Laba tahun berjalan yang dapat diatribusikan kepada: Pemilik entitas induk Kepentingan non pengendali INFORMASI LAINNYA ASET Aset segmen Aset yang tidak dapat dialokasikan Aset pajak tangguhan Lain-lain Jumlah LIABILITAS Liabilitas segmen Liabilitas yang tidak dapat dialokasikan Utang pajak Lain-lain Jumlah Pengeluaran modal Penyusutan dan amortisasi Kebakaran/ Fire 206.402.729 47.911.519 Kendaraan Bermotor/ Motor Vehicle 60.123.498 28.752.787 Pengangkutan/ Marine Cargo 20.686.532 5.047.156 Rekayasa/ Engineering 12.396.652 (1.007.991) Lain-lain/ Others *) 159.608.525 32.523.179 Jumlah/ Total 459.217.936 113.226.650 19.679.464 (129.683.484) 3.222.630 2.755.390 5.978.020 (830.400) 5.147.620 5.132.540 15.080 5.147.620 473.050.695 15.261.465 501.498.770 989.810.930 586.434.356 2.791.986 31.332.993 620.559.335 4.327.799 6.189.215 OPERATING REVENUES Premium income Income Underwriting income Income from investments - net Unallocated operating expenses Profit from operations Unallocated other income - net Profit before tax Tax expense - net Profit for the year Profit for the year atributable to: Owners of the Company Non-controlling interests OTHER INFORMATION ASSETS Segment assets Unallocated assets Deferred tax assets Others Total LIABILITIES Segment liabilities Unallocated liabilities Taxes payable Others Total Capital expenditures Depreciation and amortization 74.510.672 26.116.786 201.318.685 273.003.931 7.457.035 72.706.570 14.447.251 28.090.480 *) 175.317.053 186.516.590 *) Akun lain-lain terdiri dari rangka kapal, unit link dan aneka. Segmen geografis Grup beroperasi di empat (4) wilayah geografis utama. Bisnis asuransi berlokasi di Jakarta, Bandung, Medan, dan lainnya, usaha persewaan gedung kantor berlokasi di Jakarta. Pendapatan Berdasarkan Pasar Geografis Berikut ini adalah jumlah pendapatan Grup berdasarkan pasar geografis: Other accounts consist of hull, unit link and others. Pasar Geografis 2023 Jakarta 187.568.296 Medan 22.171.335 Bandung 52.293.216 Lain-lain 116.247.656 Jumlah 378.280.503 2022 235.370.491 26.674.991 25.761.580 171.410.874 459.217.936 Geographical Market Jakarta Medan Bandung Others Total Pendapatan berdasarkan pasar geografis/ Revenue by geographical market Geographical Segment The Group’s operations are located in four (4) principal geographical areas. Insurance businesses are in Jakarta, Bandung, Medan, and others, while office building for lease is located in Jakarta. Revenue by Geographical Market The following tables show the distribution of Group’s revenue by geographical market: - 94 -
